| Tip | ||
|---|---|---|
| ||
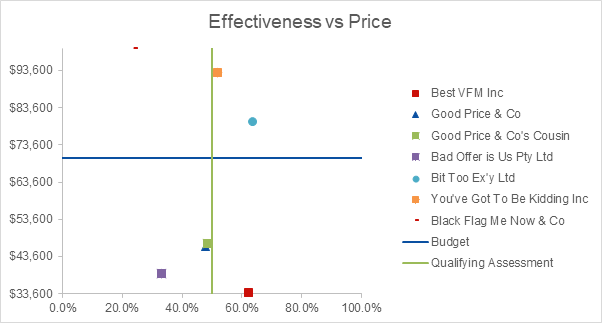
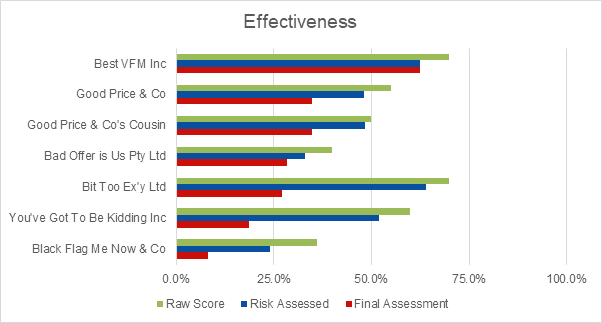
360 has two methods for graphically representing value for money:
For both of these charts, a comparison price is needed. The comparison price is commonly a tendered price but it may be calculated using any appropriate method. |
...
- The request is marked Cost Associated
- The Automatic algorithm is selected
- Each tenderer must enter the price on a Price page of the questionnaire
- The evaluation team scores each weighted question to calculate Raw Score for each response
- Each evaluation team member's risk assessment is applied to calculate a Risk Assessed Score for each response
- Each provider has VFM Points calculated using the formula:
Risk Assessed Score divided by the Price multiplied by the Median Price
- A Perfect VFM Points score is calculated as either:
100% (for the Risk Assessed Score) divided by the Lowest Price Tendered multiplied by the Median Price100% (for the Risk Assessed Score) divided by the Budget multiplied by the Median Price
- Each provider has a VFM Percentage calculated using the formula:
VFM Points divided by the Perfect VFM Points
...
- The request is marked Cost Associated
- The Manual algorithm is selected
- A Price Percentage is specified (e.g. 50% if having a low price is just as important as having high quality)
- Each tenderer must enter the price on a Price page of the questionnaire
- The evaluation team scores each weighted question to calculate Raw Score for each response
- Each evaluation team member's risk assessment is applied to calculate a Risk Assessed Score for each response
- A ratio is calculated as:
Risk Assessed Weighting vs Price Weighting - Each providers Price Score is calculated as either:
Lowest Price Tendered divided by the Tendered Price
Budget divided by the Tendered Price
- Using the ratio above, each provider has a VFM Percentage calculated
...